
[服务可观测]vllm推理服务指标监控看板搭建手册
摘要:本文介绍了vLLM推理服务监控看板的搭建过程,使用Prometheus+Grafana+vLLM-metrics组件。主要内容包括:1)环境准备,详细说明了Prometheus和Grafana的安装配置步骤;2)看板配置,包含数据源添加和仪表盘导入;3)最终效果展示。通过配置Prometheus采集vLLM服务指标,结合Grafana可视化展示,实现了对vLLM推理服务的实时监控。文章提供了
·

vllm推理服务指标监控看板搭建
组件: prometheus+grafana+vllm-metrics
1.环境准备
1.1 prometheus
安装
tar -xvf prometheus-2.54.1.linux-arm64.tar.gz

cd prometheus-2.54.1.linux-arm64
修改prometheus.yml ,新增vllm服务的metric 路径
scrape_configs:

  # The job name is added as a label `job=<job_name>` to any timeseries scraped from this config.

  - job_name: "prometheus"

    # metrics_path defaults to '/metrics'

    # scheme defaults to 'http'.


static_configs:

      - targets: ["localhost:9090"]

  - job_name: "vllm_qwen2.5-7b"

    static_configs:

      - targets: ["127.0.0.1:31005"]
服务启动
./prometheus --config.file=prometheus.yml --storage.tsdb.path=./data --web.listen-address=:9090 --web.enable-lifecycle1.2 grafana
下载压缩包,解压后可直接执行
wget https://dl.grafana.com/oss/release/grafana-11.4.0.linux-arm64.tar.gz
tar xvf grafana-11.4.0.linux-arm64.tar.gz
cd grafana-11.4.0.linux-arm64
服务启动
export GF_SERVER_HTTP_PORT=10028

$ ./bin/grafana-server --config conf/defaults.ini --homepath ./
登陆页面
端口:10028
登陆账号密码:admin/admin (初始密码)
2. 看板配置
2.1 新增数据源
地址栏输入 http://127.0.0.1:10028/connections/datasource
配置Prometheus server
http://127.0.0.1:9090
点击 save保存
2.2 导入仪表盘
地址栏输入 http://30.189.250.94:10028/dashboard/import
上传grafana.json文件
已配置的grafana.json如下:
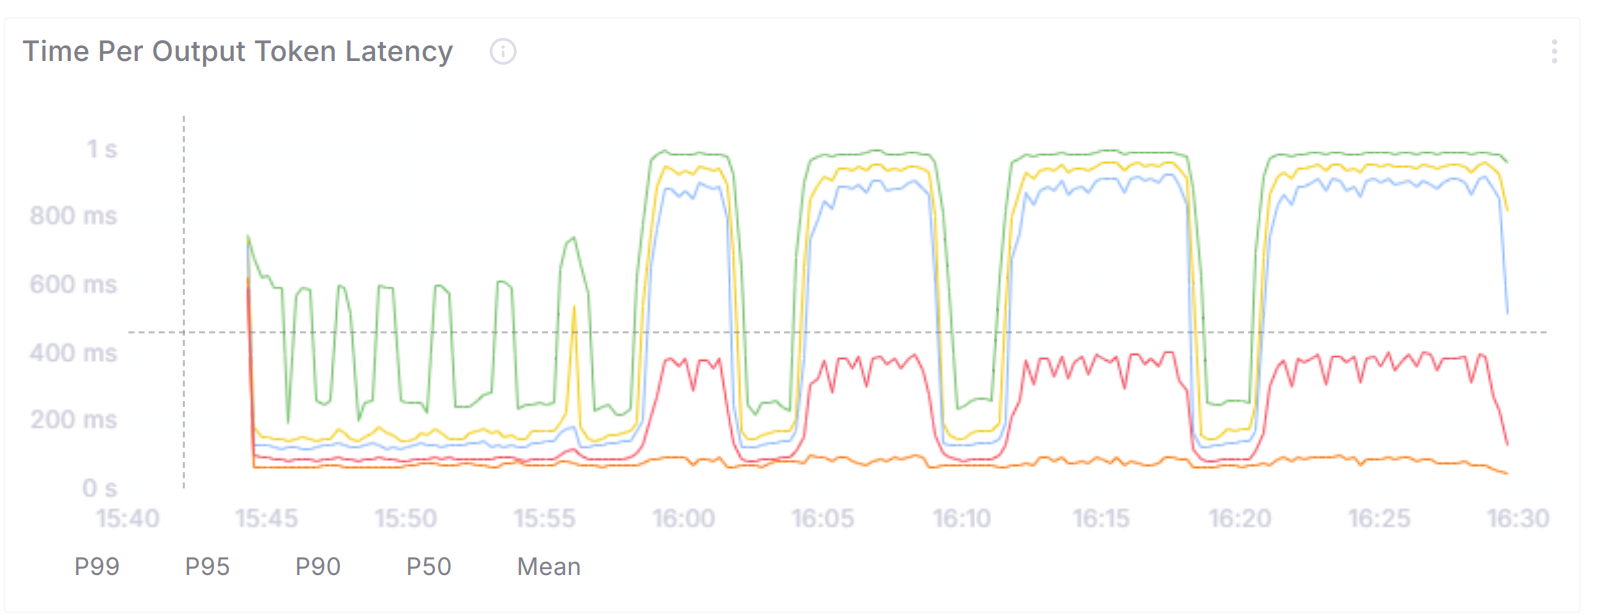
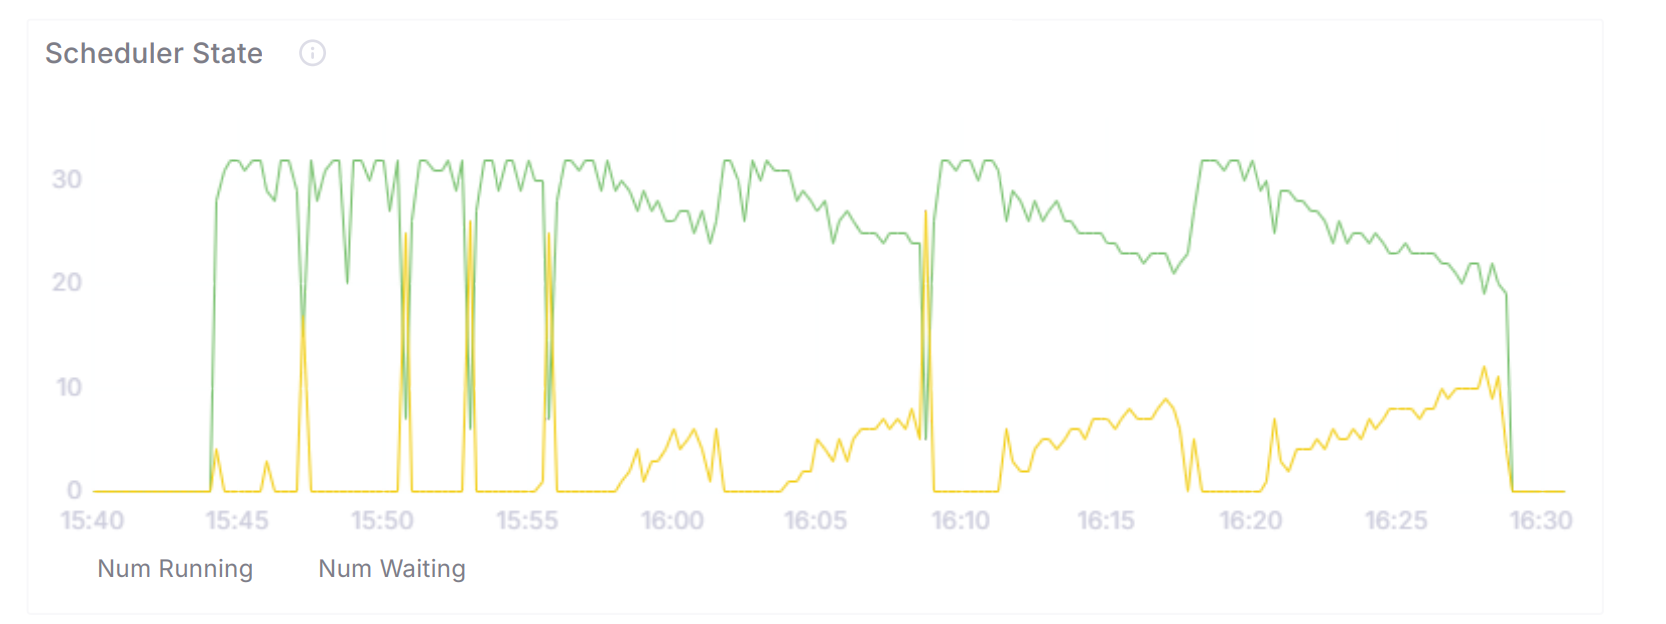
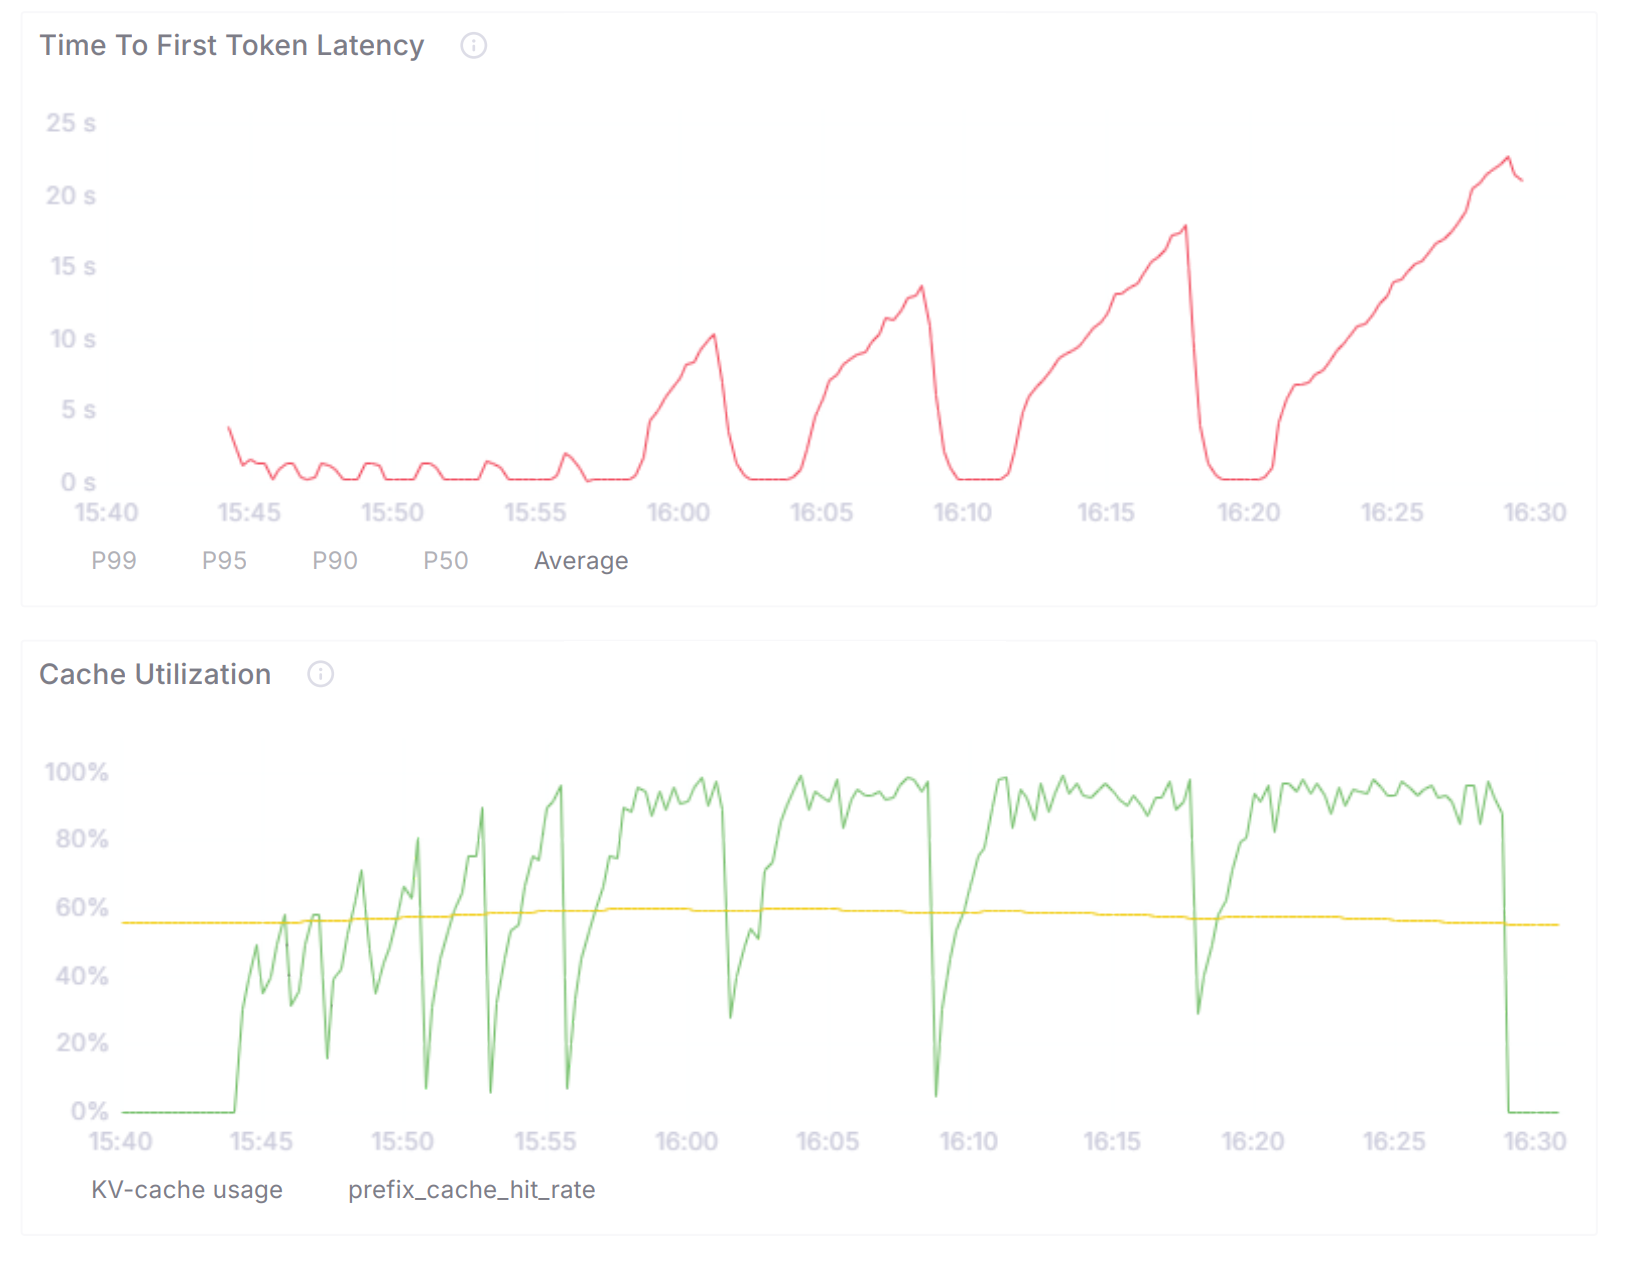
3.效果展示

电影级数字人,免显卡端渲染SDK,十行代码即可调用,工业级demo免费开源下载!
更多推荐

 5
5 0
0- 0


 已为社区贡献2条内容

所有评论(0)